All work Case 03 · Machine learning · [Year]
Flare Days
Result
12% less error than “tomorrow is like today”: 0.538 to 0.471.
- My part
- Everything, alone: the question, data pipeline, models, evaluation and write-up.
- Time
- [How long, and when.]
- Constraint
- One public export, 7.98 million rows, with weather missing on about 2 in 5.
Flaredown is a symptom tracker for autoimmune conditions: a 686 MB export of 7.98 million rows. The target was the next calendar day’s mean severity, on a 0 to 4 scale. The bar to clear is “tomorrow is like today”, and that bar is hard to beat.
[Why you picked this question, in one sentence.]
Test on the future, never on shuffled days.
The usual way to score a model is a random 80 / 20 split. Here it would let the model learn from days after the ones it predicts, and from the same person on both sides. The score would look good and mean little.
[The evidence: what a shuffled split scored against the split in time, if you ran both.]
I chose
Everything after 1 January 2019 held out, with folds grouped by person.
It cost
[What it gave up.]
The limits are in the report, not hidden from it.
| The limit | What it does | What it means |
|---|---|---|
| 2 in 5 rows have no weather data | The environment model sees less than it could. | The weather finding is real, and weaker than with full coverage. |
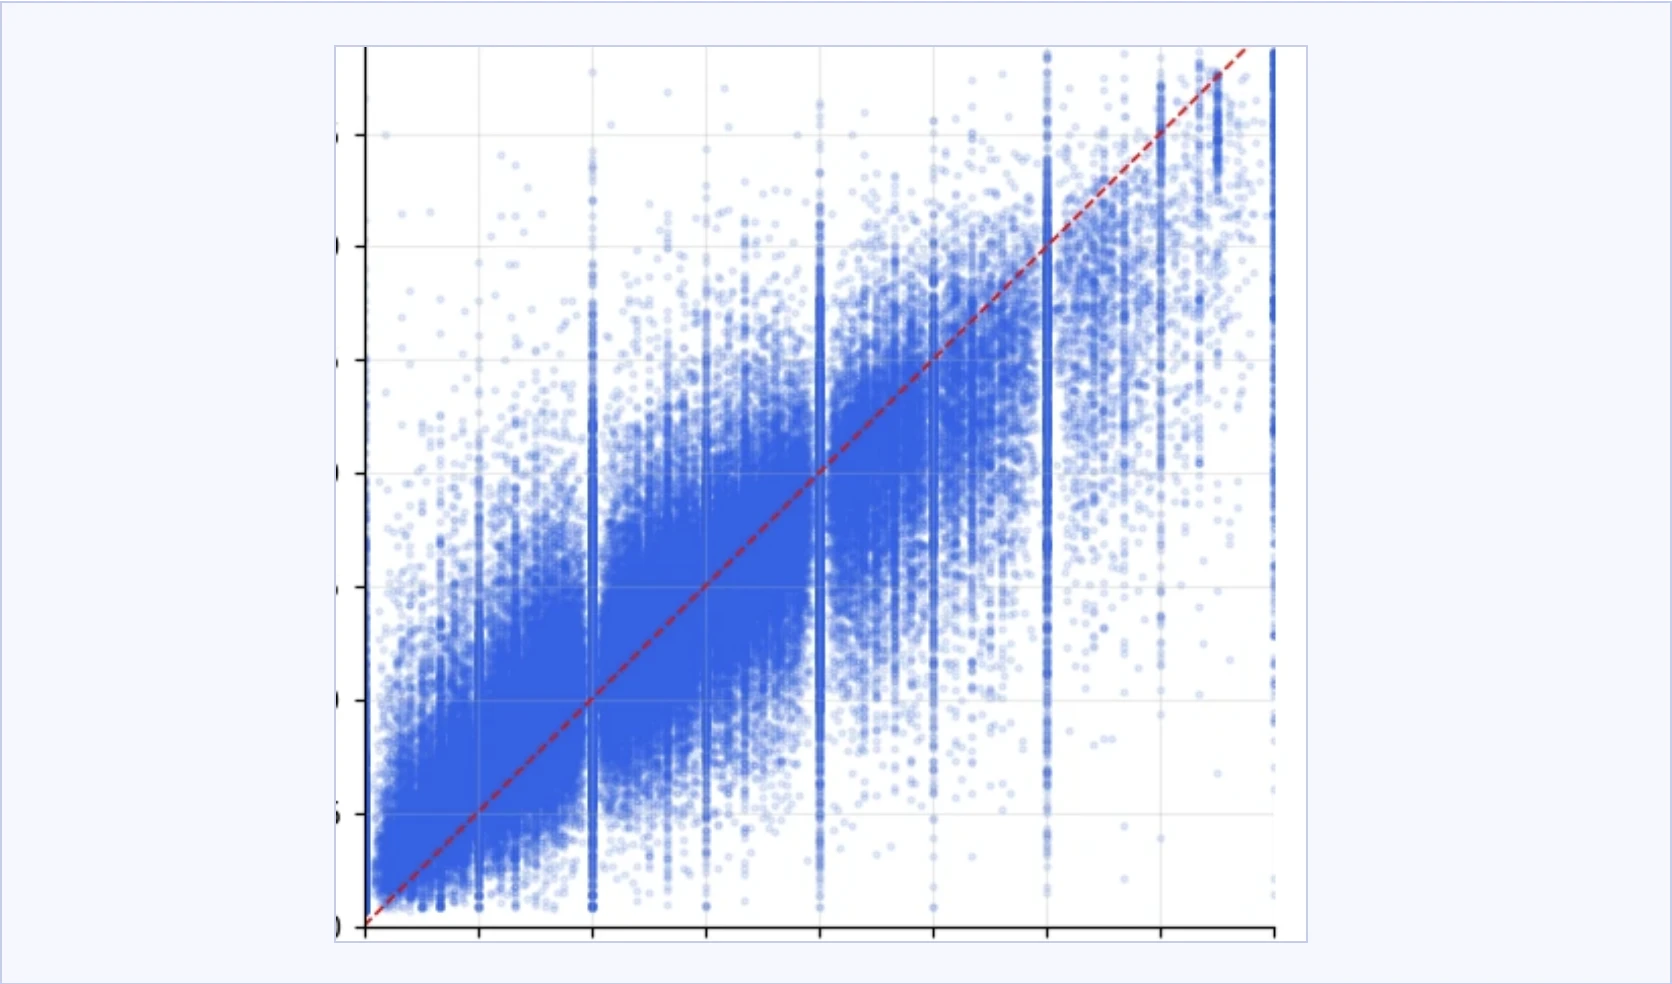
| A 0 to 4 scale, treated as continuous | Simpler to model and explain. | The cost shows as bands in the plot. |
| [A third limit from project_overview.md] | [What it does.] | [What it means.] |
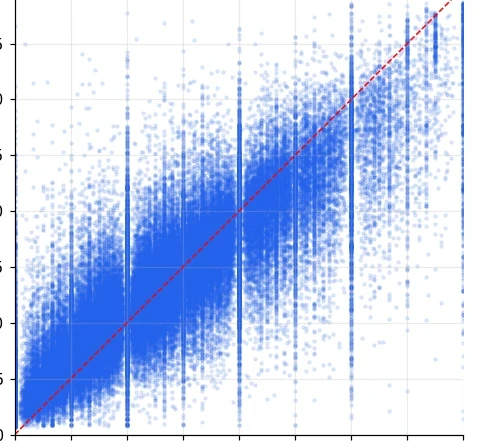
- Why the plot comes in bands Severity is a 0 to 4 scale, modelled as continuous. A documented trade-off, visible right here.
- The bar to clear “Tomorrow is like today” is hard to beat. Gradient boosting barely beat a straight line.
- The weather lost Environment alone: 0.83. The body’s own momentum: 0.48.
- Kaggle export Flaredown, 686 MB, 7.98M rows
- Target Next day’s mean severity
- Models Baseline, linear, gradient boosting
- Evaluation Hold-out 2019, GroupKFold by user
What to notice
Two hypotheses. H1: a simple model beats “tomorrow is like today”. Supported. H2: a person’s own history predicts better than their environment. Supported, by a wide margin. [Confirm: were they fixed before the models ran?]
0.48 / 0.83
Grouped-CV RMSE: a person’s own symptom history against their environment alone. Recent symptoms predict tomorrow far better than the weather does. A study, so there are no users to count.
[What you would do differently, concrete enough to be wrong.]